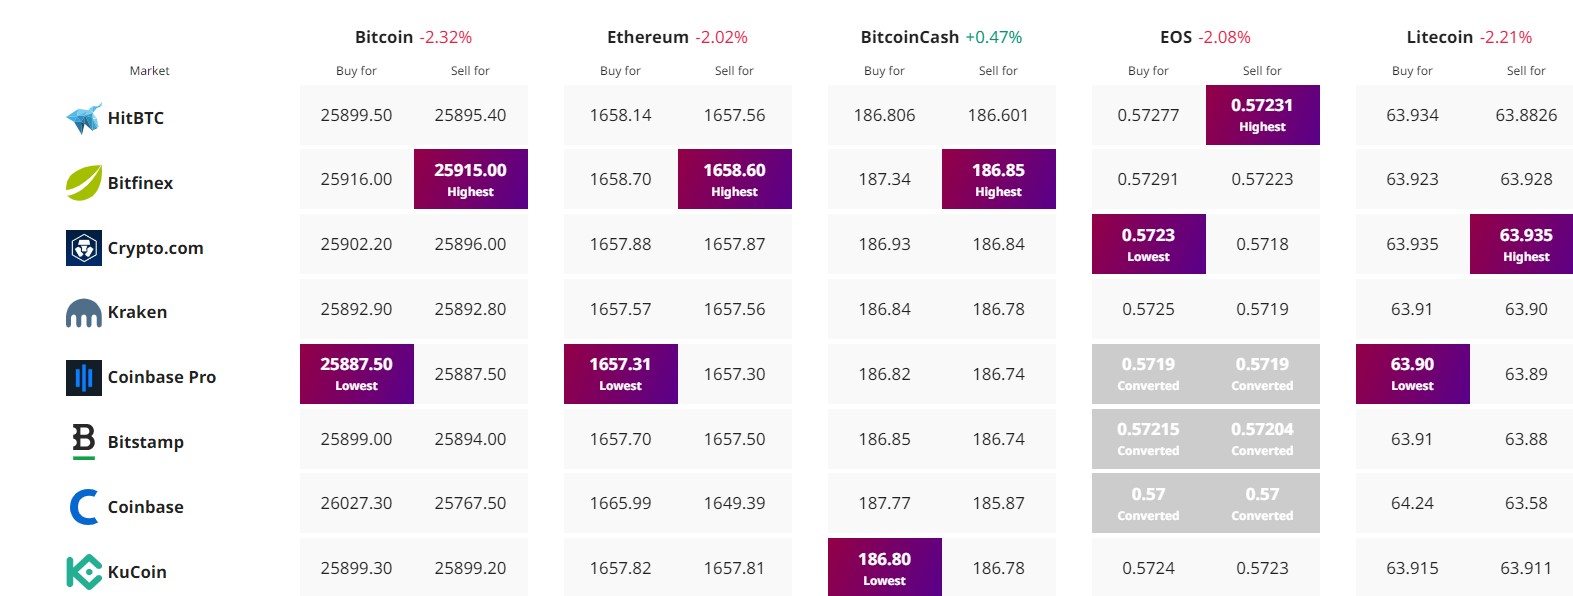
The volatile world of cryptocurrency has once again captured global attention, with prices experiencing a sharp downturn. As Bitcoin, the leading digital currency, faces a significant price drop, many are left speculating on its future trajectory.
Today’s live Bitcoin price stands at $25,882, marking a decrease of nearly 2.5% in the past 24 hours. With a formidable trading volume of $20 billion, Bitcoin retains its #1 position on CoinMarketCap, boasting a live market cap of $503 billion.
In light of these figures, the looming question remains: will BTC’s price continue its descent?
Bitcoin Price Prediction
Bitcoin’s technical landscape showed notable activity after it fell below the $29,000 mark on August 6th.
Currently, its value has experienced a substantial decline, trading around the $25,800 range.
Analyzing the four-hourly timeframe, the leading cryptocurrency, Bitcoin, has shown “Three Black Crows’ candlestick patterns, signaling a strong bearish sentiment in the market.
Concurrently, the Relative Strength Index (RSI) and the Moving Average Convergence Divergence (MACD) oscillators have both entered the oversold territory, underscoring the prevailing bearish dominance.
The 50-day Exponential Moving Average (EMA) is positioned around the $27,300 mark, with recent candle closings indicating sustained bearish momentum.
As of now, the immediate resistance is situated around $26,200. The closing of a two-day candle pattern and the appearance of a bearish engulfing candlestick below this mark suggests that bearish pressures persist below the $26,200 level.
If this trajectory continues, Bitcoin could potentially fall to $25,600, with a further drop to the $25,200 threshold.
Conversely, if Bitcoin surpasses the $26,200 level, it might target the next resistance at $26,800.

A sustained upward move could even push BTC’s price toward $27,300 and eventually to $27,600.
A decline below the $25,200 mark could open the door for further losses, potentially reaching as low as $24,800.
The aggregate insights from technical indicators, including the 50-day EMA, RSI, and MACD, combined with the ‘ Three Black Crows’ and bearish engulfing candle patterns on the four-hourly chart, consistently suggest bearish dominance.
It’s imperative for investors to closely monitor the $26,200 benchmark, as moves below this level could signify further declines.
Top 15 Cryptocurrencies to Watch in 2023
Discover the latest initial coin offering (ICO) projects and alternative cryptocurrencies by regularly browsing our thoughtfully selected collection of the top 15 digital assets to keep an eye on in 2023.
This carefully curated list has been compiled by industry experts from Industry Talk and Cryptonews, providing you with professional recommendations and valuable insights.
Keep up with the rapidly evolving world of digital assets and stay ahead of the game by exploring the potential of these cryptocurrencies.
Find The Best Price to Buy/Sell Cryptocurrency

Disclaimer: Cryptocurrency projects endorsed in this article are not the financial advice of the publishing author or publication – cryptocurrencies are highly volatile investments with considerable risk, always do your own research.


